2
\$\begingroup\$

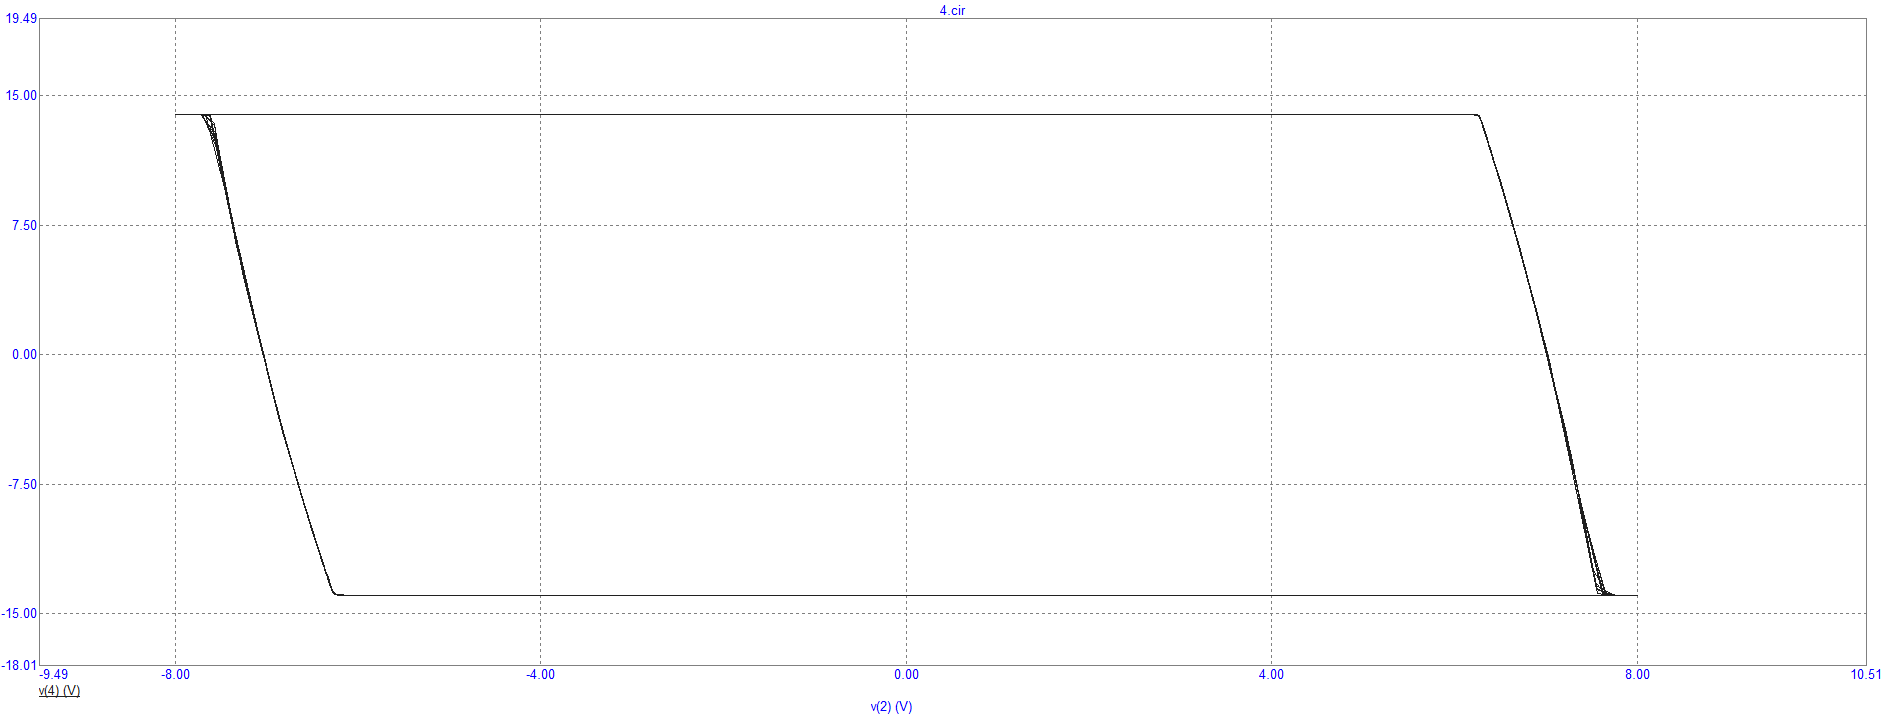
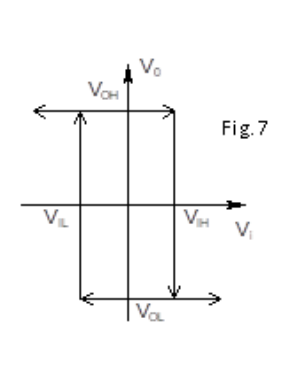
I was doing an assignment about op amps and I had to simulate a Schmitt Trigger and plot its transfer curve. The assignment handout gave me a plot to compare the curve with. Here are both the plots, first being the given one and second is the one I obtained.

Given curve, rectangular in shape

Obtained curve through simulation, parallelogram-esque

I thought as to why my curve is not rectangular like the given curve and more of a parallelogram. I know that in a Schmitt Trigger, when V+ > V−, then the output will raise V+ even higher until it reaches the positive bound; and when V- > V+, it will fall until it reaches the negative bound. I understand in practical conditions, the 'rising' and 'falling' will not be abrupt.

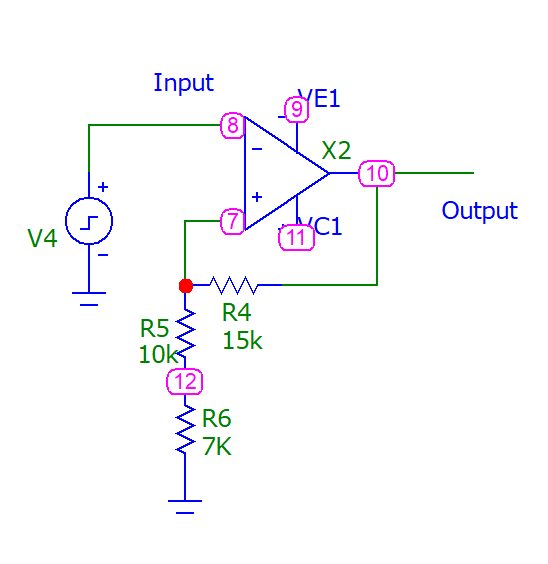
However, I can't really develop a scientifically coherent understanding behind this and supply proper logic rather than just intuition. Any help would be appreciated, thanks. Here's the circuit for reference.

Opamp Schmitt Trigger Circuit

\$\endgroup\$
6
  • 1
    \$\begingroup\$ What opamp / comparator are you using? At what speed is the input changing? If you measure "too fast" then you might see slewing i.e. the opamp's output cannot follow fast enough. \$\endgroup\$ Commented Sep 28, 2021 at 11:31
  • \$\begingroup\$ LM741. The maximum runtime of the transient analysis is 10ms. I don't quite understand how to give you a value of the changing input speed. \$\endgroup\$ Commented Sep 28, 2021 at 11:36
  • \$\begingroup\$ The LM741 is a notoriously terrible op amp; try using something less ancient. \$\endgroup\$
    – Hearth
    Commented Sep 28, 2021 at 11:48
  • \$\begingroup\$ @Hearth Haha. Unfortunately, it's not in my control for this assignment. It's specified to use it. :) \$\endgroup\$ Commented Sep 28, 2021 at 11:49
  • \$\begingroup\$ The maximum runtime of the transient analysis is 10ms Now make that 1000x slower so 10 seconds. You will have to slow down the speed of the input signal as well. Then simulate again. \$\endgroup\$ Commented Sep 28, 2021 at 12:04

2 Answers 2

2
\$\begingroup\$

You are right about the opamp being unable to instantly change its output potential. The reason for this is mainly parasitic capacitance and inductance present at every point in every circuit.

Choose any two points in a circuit, and those two points will have some amount of capacitance between them, which makes it impossible for potentials at either point to change independently of each other. Usually it's very small, and the effect is hardly noticeable, but when you start measuring things in microseconds and megahertz, you start to see its effects. Capacitance is manifest as an inability for the voltage somewhere to change instantly.

The same goes for inductance. No current path in any circuit is completely without inductance. Current makes magnetic fields, and magnetic fields make inductance. Inductance has the effect of causing current to continue to flow even when EMF is removed, and also to prevent current to begin flowing immediately as EMF is applied. The upshot is that electric current cannot change instantly in any conductor.

These two effects are present everywhere in real life op-amps (and indeed any component or circuit). Undesired capacitance in particular is compounded by their small size. All their nodes and current paths are so close together, that they all form "parasitic" capacitors with each other.

The two parameters of an op-amp which are most affected by parasitic capacitance are bandwidth and slew rate, the latter being related directly to your question. Slew rate is the maximum rate of change of potential that the output is able to achieve. In the datasheets for the popular TL071 and LM358 opamps, their output slew rates are clearly specified:

TL071

enter image description here

LM358

enter image description here

From this data it's clear that the TL071 will out-perform the LM358 in terms of sharpness of transistion in the role of schmitt trigger.

\$\endgroup\$
5
  • \$\begingroup\$ Looking at Andy's answer above, do you mean that this slew rate leads to a non-infinite gain? \$\endgroup\$ Commented Sep 28, 2021 at 11:20
  • \$\begingroup\$ The gain is NEVER infinite. The gain is always limited. Do realize that at high gain (which applies here, you're using the opamp as a comparator) the opamp becomes SLOW. It will only change the output with a certain limited speed (slew rate). If you plot the output curve too fast, you will see that slope. \$\endgroup\$ Commented Sep 28, 2021 at 11:29
  • \$\begingroup\$ @Bimpelrekkie I get that it's not infinite. What I meant was it tends to infinity IDEALLY. Does it not? \$\endgroup\$ Commented Sep 28, 2021 at 11:41
  • \$\begingroup\$ What I meant was it tends to infinity IDEALLY. Does it not? No, "tends to infinity" doesn't mean much. What you could say is that you assume that the gain is infinite and that if that were true (and there are no other non-ideal effects, which there are), that you'd get the ideal curve. But you're still missing the point. Your sloped curves are not caused by the (lack of) gain. But by the fact that the opamp is too slow. \$\endgroup\$ Commented Sep 28, 2021 at 11:58
  • 1
    \$\begingroup\$ @VijayBharadwaj: Gain is about where the opamp wants the output to be, slew rate is about how quickly the output gets there. If the two are related, it's a very tenuous relationship. For instance, if the output is unable to reach where it's supposed to be quickly enough to follow the input, the output signal amplitude will be smaller than it should be, but it's not because of a problem with gain. \$\endgroup\$ Commented Sep 28, 2021 at 12:48
2
\$\begingroup\$

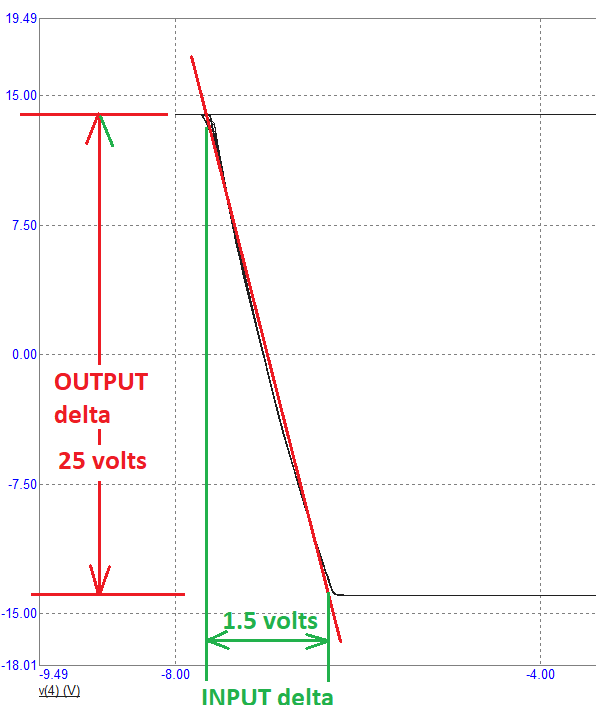
Take a look at this: -

enter image description here

The input changes 1.5 volts and the output changes by about 25 volts hence, the slop of the line is the gain of the amplifier. But, if when you made you hysteresis graph the XY speed was plotted in microseconds (rather than seconds) then rise-time, fall-time and propagation delay will all cause the slope to be flattened.

\$\endgroup\$
7
  • \$\begingroup\$ So essentially, non-infinite gain of opamp is causing this? \$\endgroup\$ Commented Sep 28, 2021 at 11:14
  • \$\begingroup\$ @VijayBharadwaj that's the best interpretation I can give it but, if when you made you hysteresis graph the XY speed was plotted in microseconds (rather than seconds) then rise-time, fall-time and propagation delay will all cause the slope to be flattened. \$\endgroup\$
    – Andy aka
    Commented Sep 28, 2021 at 11:41
  • \$\begingroup\$ Okay, thank you. On an additional note, if I want to achieve a rectangular curve, can you suggest something about how to fiddle with these limits to get it? imgur.com/a/mK2A3gD \$\endgroup\$ Commented Sep 28, 2021 at 11:47
  • \$\begingroup\$ @VijayBharadwaj Aha you are using micro-cap - set the run time to be lower to get the full idea of what the real gains are likely to be. \$\endgroup\$
    – Andy aka
    Commented Sep 28, 2021 at 11:54
  • \$\begingroup\$ On reducing the runtime, parts of graph just keep disappearing. \$\endgroup\$ Commented Sep 28, 2021 at 12:02

Your Answer

By clicking “Post Your Answer”, you agree to our terms of service and acknowledge you have read our privacy policy.

Not the answer you're looking for? Browse other questions tagged or ask your own question.