3
\$\begingroup\$

I'm working on a project using some 5mm through-hole LEDs that I purchased. I want to simulate my circuit in LTspice before soldering it. However, none of the built-in LEDs in LTspice are close to the ones that I have.

I have measured some IV sample data. For example, this is the from the 5mm green LED: V1 = 2.61, I1 = 5mA; V2 = 2.46, I2 = 2.5mA; V3 = 2.24, I3 = 0.28mA; V4 = 2.14, I4 = 29uA; V5 = 2.03, I5 = 3.0uA.

I want to compute the model parameters and add them to the "standard.dio" file. This is an example of a built-in LED: ".model NSCW100 D(Is=16.88n Rs=8.163 N=9.626 Cjo=42p Xti=200 Iave=30m Vpk=5 mfg=Nichia type=LED)".

With the Shockley diode equation, and 3 measured IV samples, I can compute Is, Rs and N. I have two questions: (1) How to do regression analysis with more than 3 samples? My maths knowledge only allows me to solve a linear model, but the Shockley diode equation is nonlinear. (2) Are there any existing tools or websites that compute this? If no, I'd like to make my wheel.

\$\endgroup\$
2

3 Answers 3

7
\$\begingroup\$

There are three key parameters that you need for a diode. These are:

  • The intersection point on the y-axis often called the saturation current for the diode: \$I_{_\text{SAT}}\$
  • The ideality factor or emission co-efficient: \$\eta\$
  • The bulk resistance that includes wire-bonding and other details: \$R_{_\text{S}}\$

This means you need at least three data points. But if just three, they need to be carefully selected.

There's some difficulties when using regression. We are dealing with what are essentially exponential curves. The problem has to do with the meaning of noise (unpredictable variations) and how important that noise is with respect to measurement points. It's not simple or linear. So you need to write special codes that take into account the meaning of noise with respect to where you are on the exponential curve, itself. This leads to some more interesting mathematics. I've a white paper on the topic and could publish it. But for now all I want to do is make you aware of the issue.

In any case, your data should be about (and I don't believe these numbers):

$$I_{_\text{D}}=6.1\times 10^{-25}\:\text{A}\cdot\left(\exp\left[\frac{V_{_\text{D}}-50\:\Omega\cdot I_{_\text{D}}}{1.8\,\cdot\,V_T}\right]-1\right)$$

Above, \$\eta=1.8\$, \$R_{_\text{S}}=50\:\Omega\$ and \$I_{_\text{SAT}}=6.1\times 10^{-25}\$.

You can solve this with a closed equation for \$I_{_\text{D}}\$ using the product-log function, if you want.

But yes, you can use data from a curve to develop the diode parameters. More data is better. But data that doesn't involve \$R_{_\text{S}}\$ (low currents) are needed to develop \$\eta\$ and \$I_{_\text{SAT}}\$. And data with higher currents are needed to develop \$R_{_\text{S}}\$.

\$\endgroup\$
1
  • \$\begingroup\$ Thank you. Given Id, it's very easy to solve Vd, but the other way around. But anyway, I don't think there exist a closed form solution for regression. Some iterative search is needed. I made a online tool for that. Please check my answer. \$\endgroup\$ Commented Nov 4, 2023 at 11:39
3
\$\begingroup\$

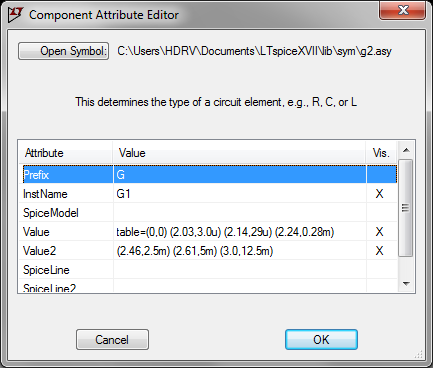
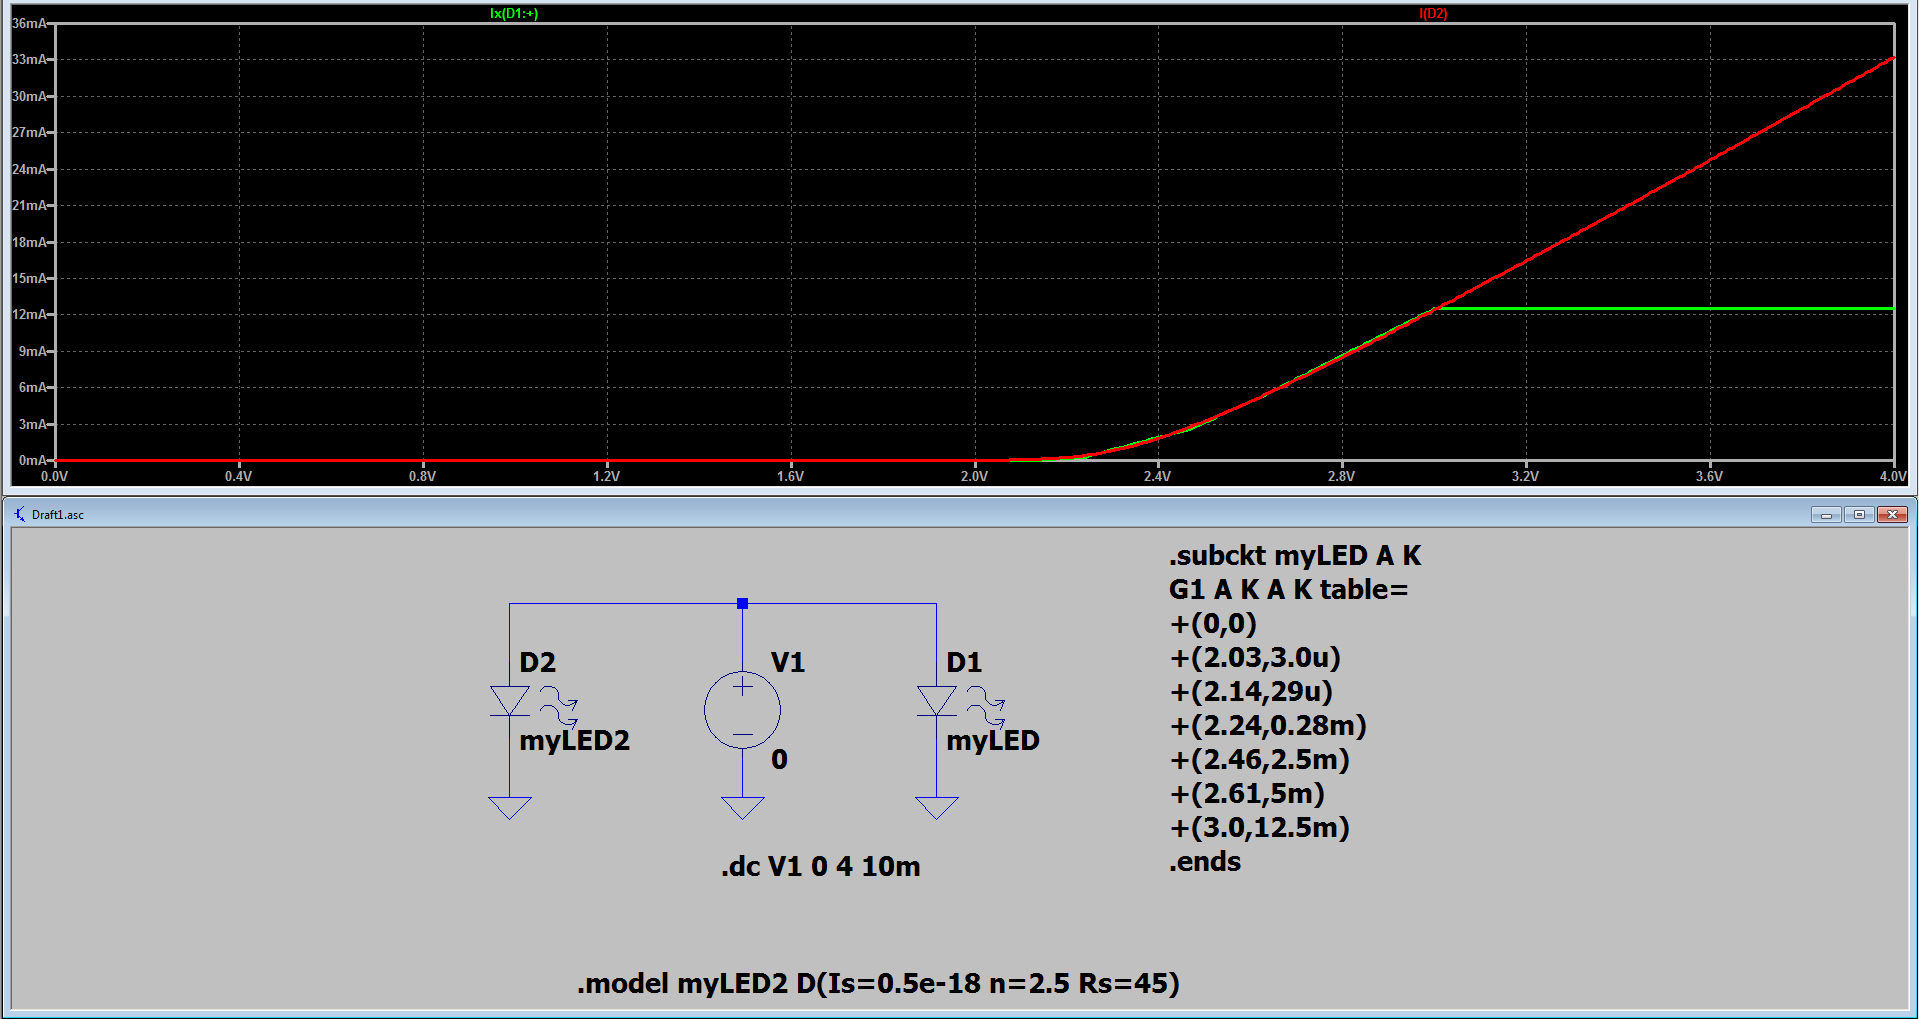
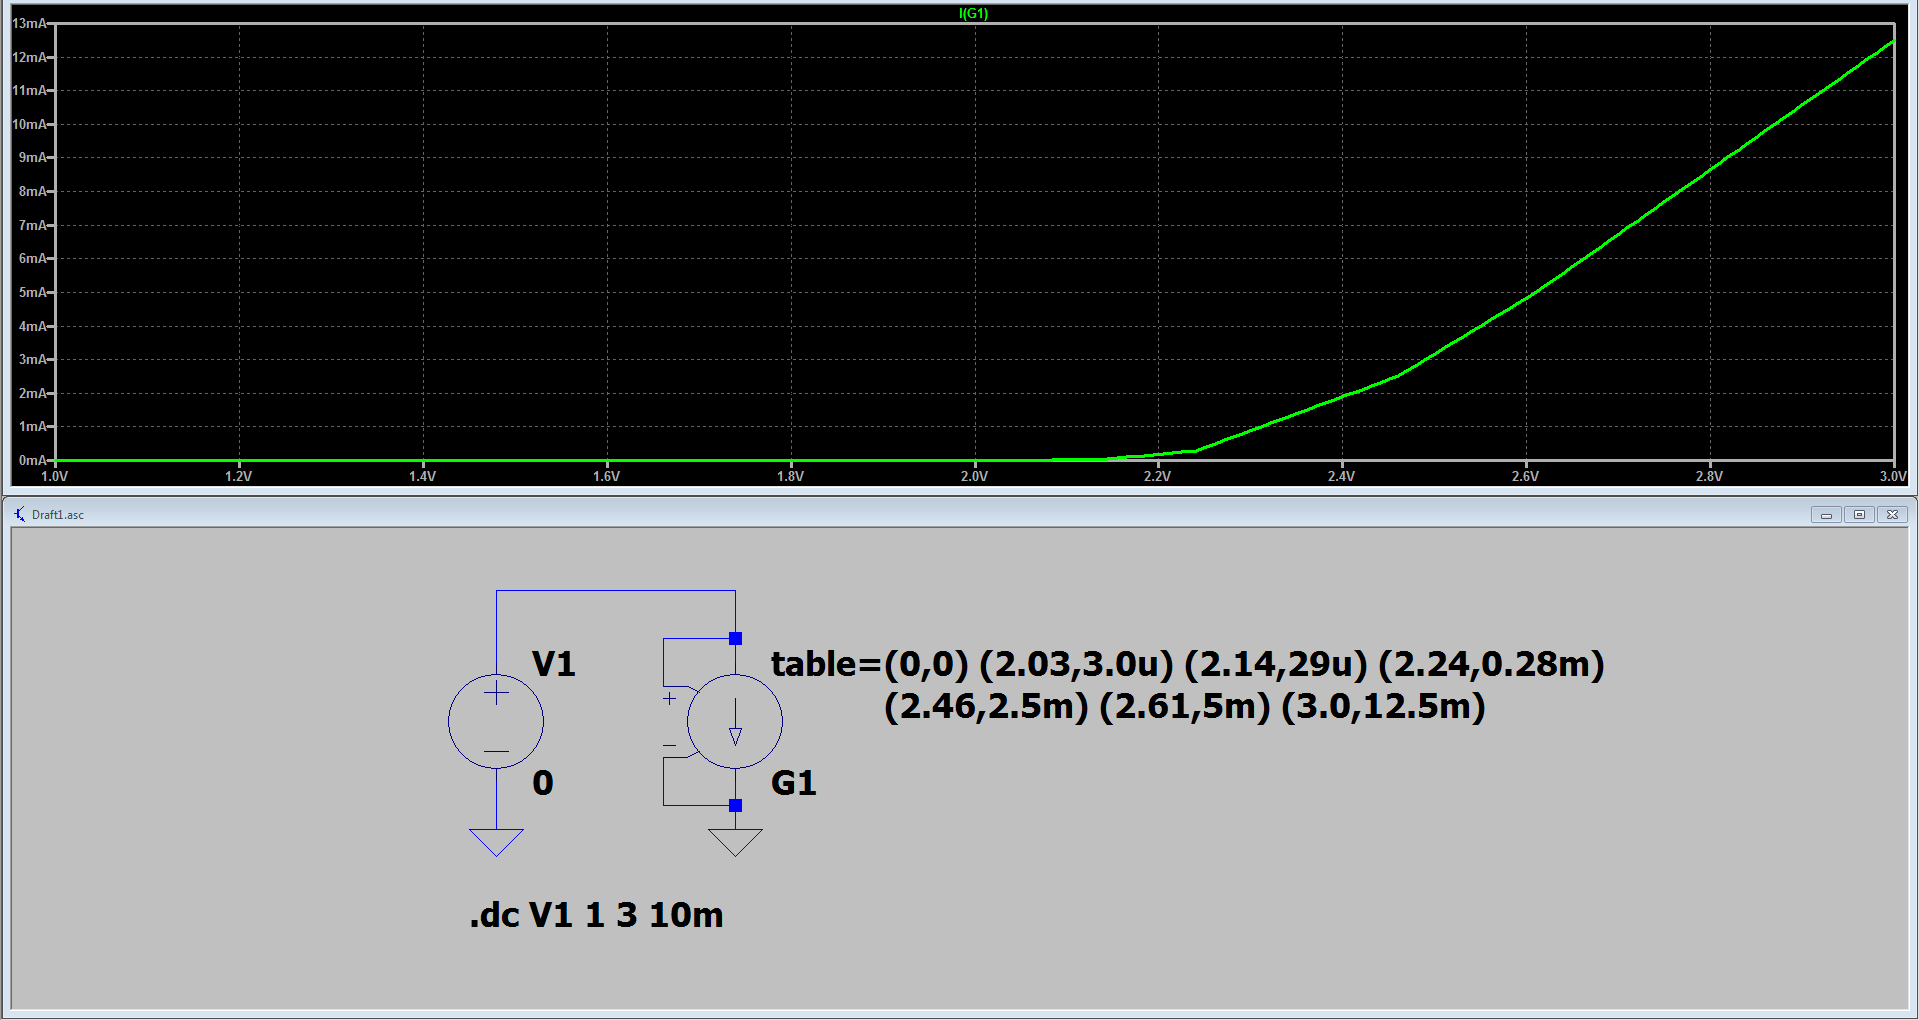
Instead of making an intrinsic diode model from your I-V data-points, you can also use your data-points directly. You can make a G-source with the table keyword, and then include your data points as value pairs, like shown below:

enter image description here

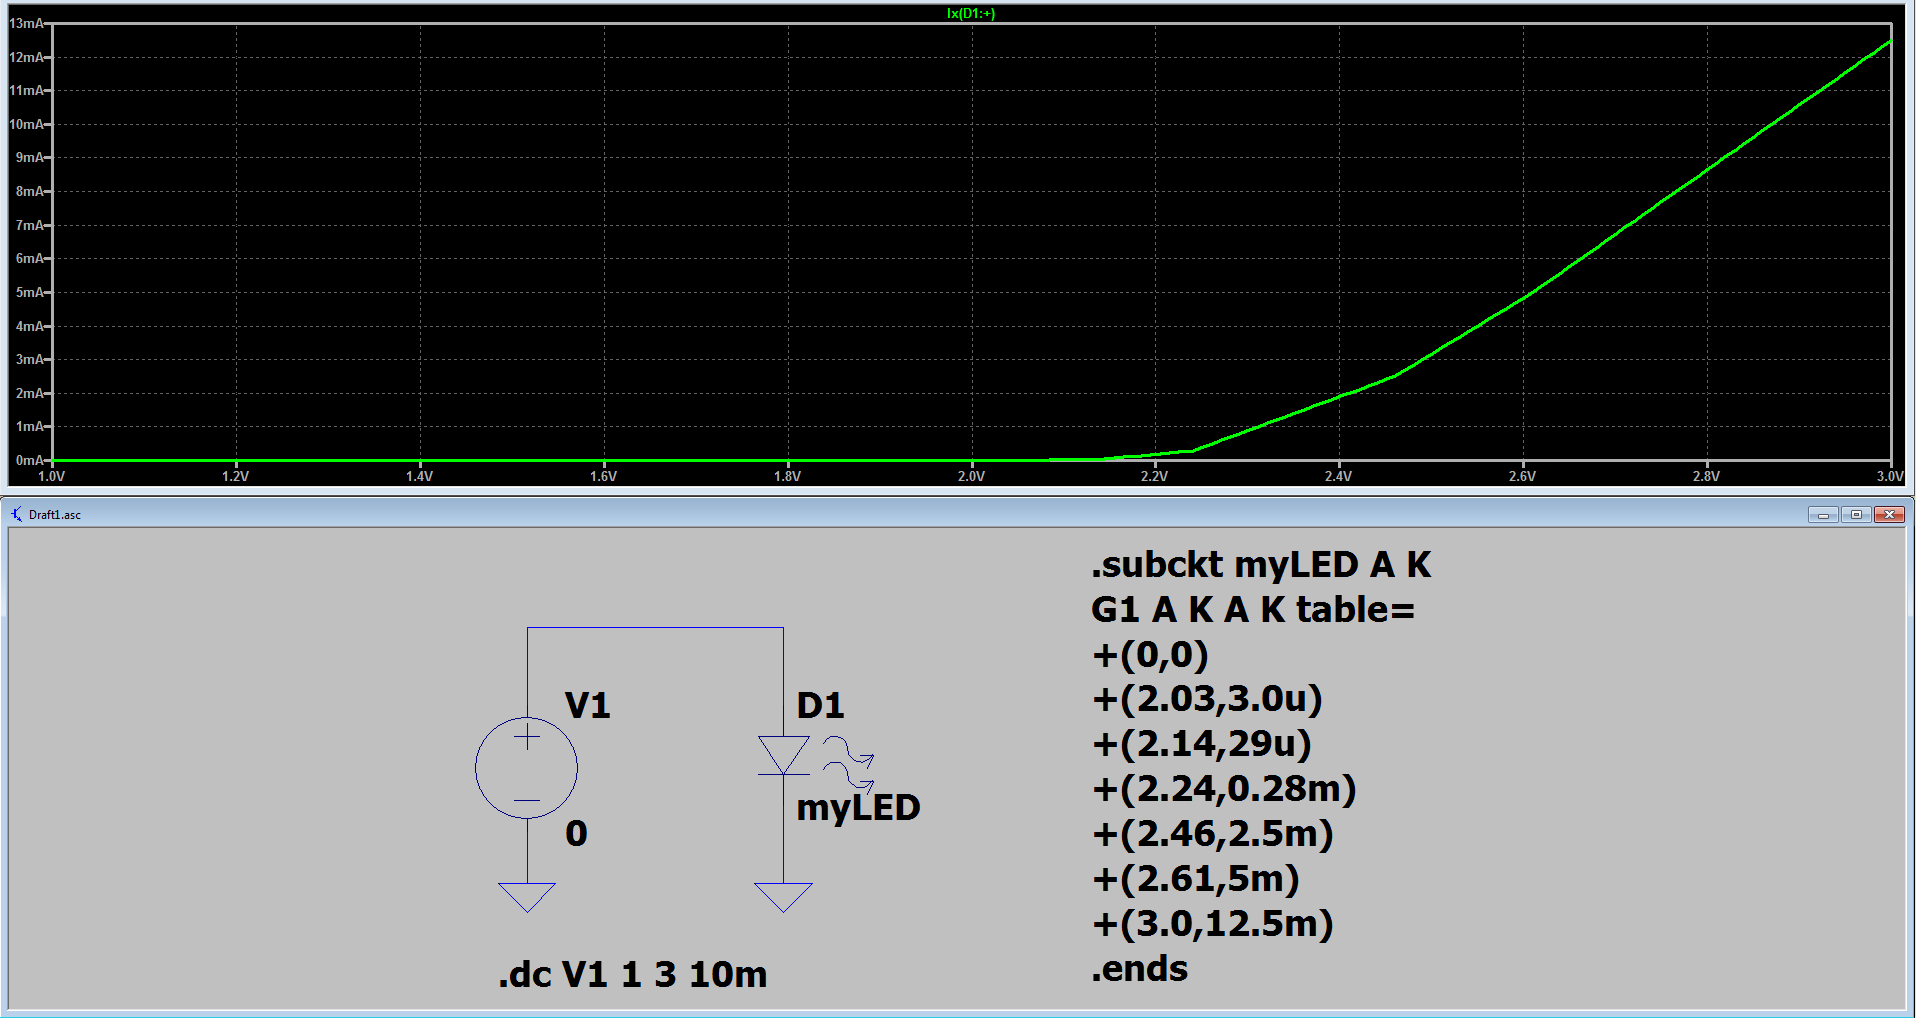
The trick is to use the g2 symbol as your diode. Then orient the symbol and connect the control voltage inputs like I have done in the schematic. Right-clicking the symbol is where you enter in the data. I used the Value and Value2 fields for table definition. You can spread it out to more lines if you like by using SpiceLine and SpiceLine2. I added the (0,0) and (3.0,12.5m) points to better fill in the extremes of the curve.

enter image description here


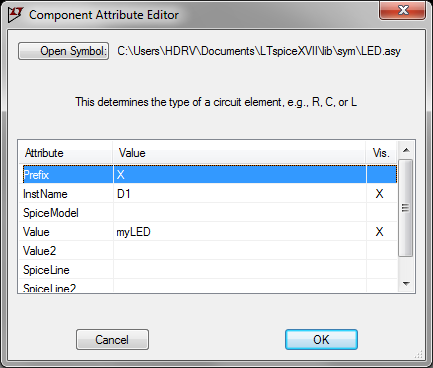
By now you can see a downside to this which is that lots of data can create a large clutter. One way around this is to define the G-source within a subcircuit. You can put that in a SPICE directive off the side (as shown) or if it's still too much clutter you can put it in a text file and .lib-it. One nice thing about this is you can even use the existing LTspice LED symbol on your schematic so it's easier to look at. You just have to CTRL+rightclick to change the symbol's Prefix from D to X (as shown).

enter image description here

enter image description here


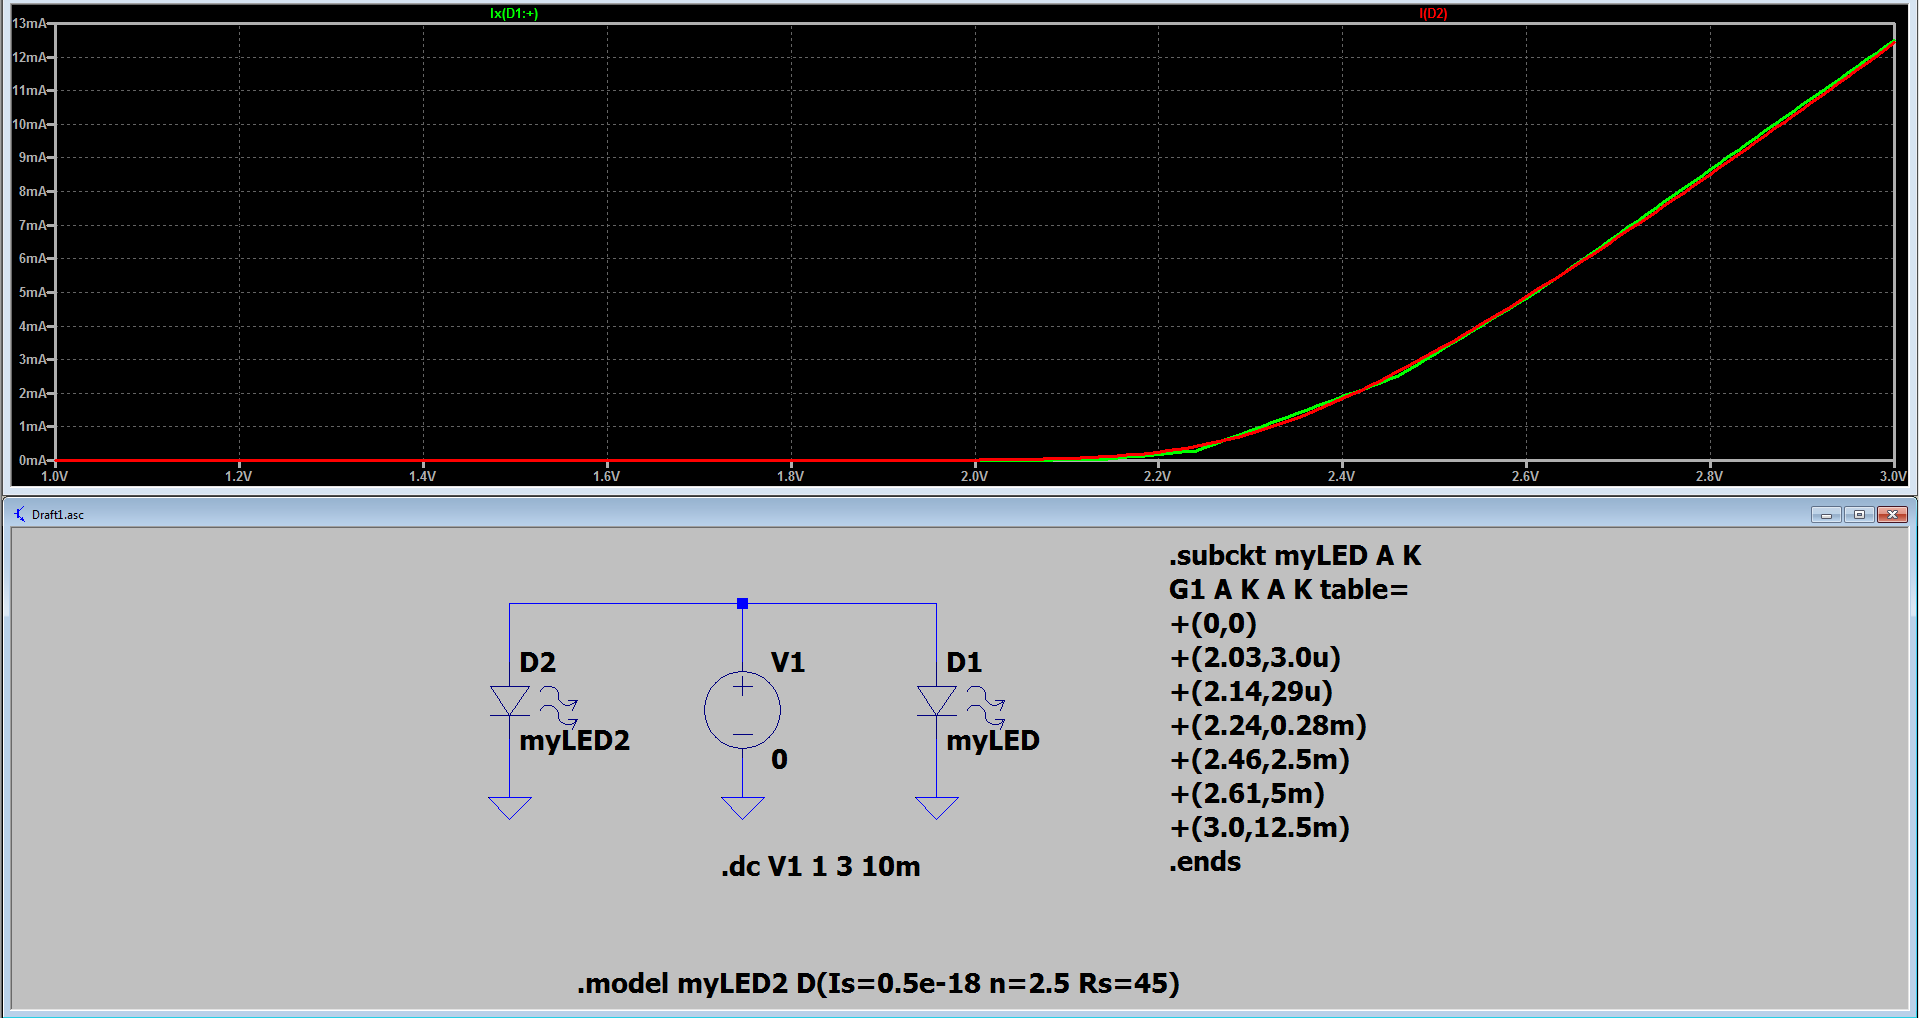
Lastly, you can use the above method in conjunction with John Doty's comment to map the I-V data to an intrinsic diode model via trial and error. Nice benefits of using an intrinsic diode model are that temperature effects are modeled as well as noise (when you do a .noise analysis).

enter image description here


Extending the DC sweep range a bit shows a huge downside to using the table method directly as a model. The endpoints of the table are extrapolated with horizontal lines off to each side, so you need to include more points for the table if you expect your use-case to fall on those parts of the diode curve.

enter image description here

\$\endgroup\$
1
  • 1
    \$\begingroup\$ Thank you. This is a very interesting solution. Learned something new. \$\endgroup\$ Commented Nov 4, 2023 at 11:41
1
\$\begingroup\$

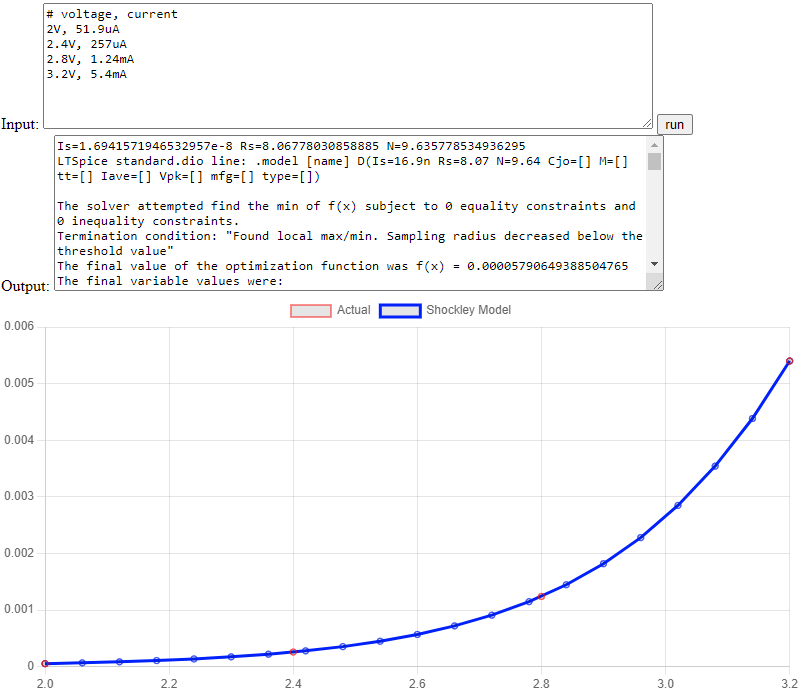
I made a online tool to solve diode model parameters. It finds the three DC characteristics parameters (Is, Rs and N). Below is the screenshot. screenshot

\$\endgroup\$
1
  • \$\begingroup\$ Very cool! Thanks for sharing! \$\endgroup\$
    – Ste Kulov
    Commented Nov 4, 2023 at 23:59

Your Answer

By clicking “Post Your Answer”, you agree to our terms of service and acknowledge you have read our privacy policy.

Not the answer you're looking for? Browse other questions tagged or ask your own question.