in "Lessons in Electric Circuits", VOL III, ChPT 14, there is a SPICE simulation of this transmission line:
The author writes:
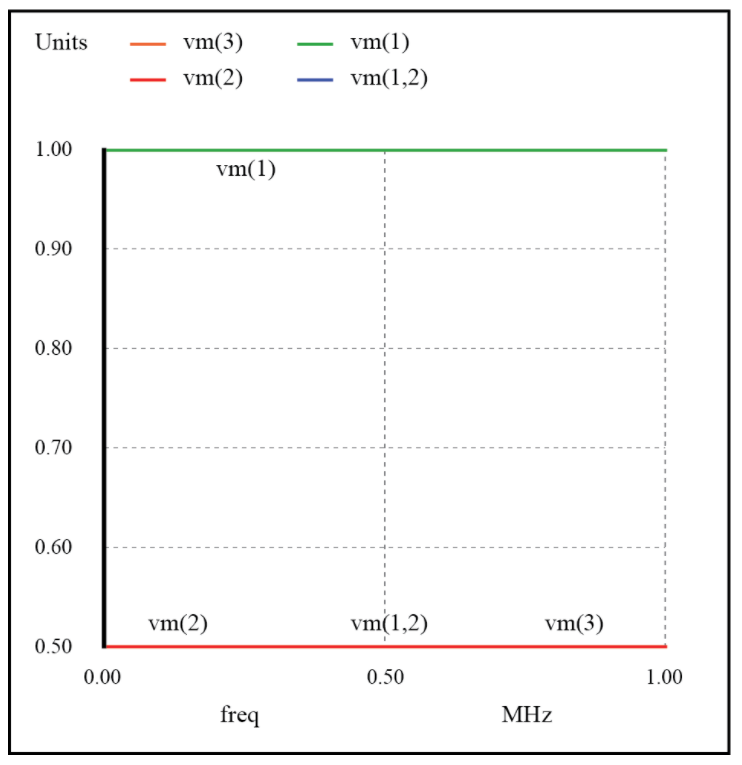
Running this simulation and plotting the source impedance drop (as an indication of current), the source voltage, the line’s source-end voltage, and the load voltage, we see that the source voltage—shown as vm(1)(voltage magnitude between node 1 and the implied ground point of node 0) on the graphic plot—registers a steady 1 volt, while every other voltage registers a steady 0.5 volts: (Figure below)
and inserts this graph with all voltages referred to the node 0:
You may see that the point 0 is chosen as a reference node. How can this choice be correct? The points indicated with 0 in the first figure are not a single circuital node, since they don't have the same electric potential.


