6
\$\begingroup\$

I am trying to understand metastability as introduced in the Technion IEEE paper (link). But I am struggling a little with some of the concepts, and wanted to ask about that.

This is the flip-flop circuit they are using: enter image description here
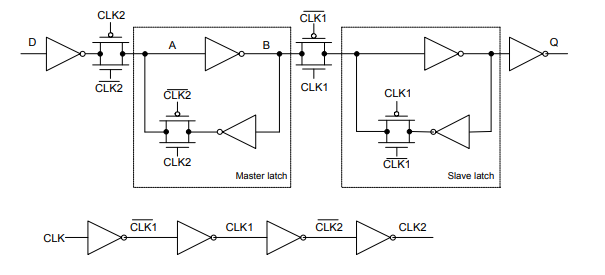
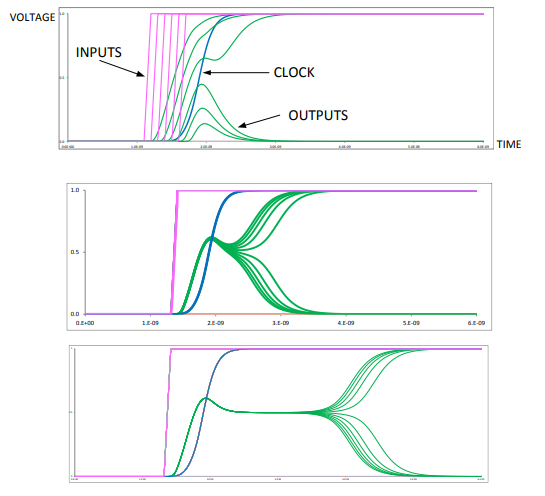
Question: They mention that when the input D to the FF changes right as CLK2 is turning high, it can introduce metastability in the master latch. They present the following graph by playing around with the relative timing about D and CLK2 to show how metastability is introduced in the circuit.

enter image description here

Caption under the image: Empirical circuit simulations of entering metastability in the master latch of Figure 2 (left). Charts show multiple inputs D, internal clock (CLK2) and multiple corresponding outputs Q (voltage vs. time). The input edge is moved in steps of 100ps, 1ps and 0.1fs in the top, middle and bottom charts, respectively.

I do not understand why moving the input edge by different time steps produces such varied plots. The relative input - clock timings are the same, only the time steps are varied. Why does it take the circuit so long to stabilize in the 3rd case compared to the first?

I looked at the literature references they mentioned, and also in my notes, Wiki, university lectures on metastability but to no avail.

Thank you!

\$\endgroup\$
0

2 Answers 2

7
\$\begingroup\$

Why does it take the circuit so long to stabilize in the 3rd case compared to the first?

The 3rd case is much closer to the balance point of this particular gate. The search time step determines how close the closest curve will be.

As an analogy:

You are trying to balance a ball on a hill, but don't know where the hill is. You try different points at 1 meter interval. Some balls roll left, some balls roll right. Then you try points every 1 cm in the interval where the direction changed. Finally, you try every 1 mm and find a spot where the ball stays balanced.

Theoretically there exists a point where the flip-flop will stay metastable for infinite time. But in practice there is always noise and fluctuations that will eventually push it to one side or the other.

\$\endgroup\$
5
\$\begingroup\$

They are trying to show you that meta stability is essentially a chaotic process, i.e. a butterfly flaps its wings here and a tornado happens 1000km away.

They are showing you that as long as the timing requirements of the FF are violated, i.e. setup-time violation, that is input edge is too near the clock edge, then even a slight variation in the timing can provoke big changes in the output.

In the first graph they show that a difference of 100ps between steps causes differences in the output, as expected, but as the steps become smaller, there is a part of the output that remains the same, but still the output final state cannot be predicted, even if the steps are extremely close together. No matter how small a variation in input timing, the output end state cannot be predicted and can be either 0 or 1, and the time to settle to that state increases.

\$\endgroup\$
4
  • \$\begingroup\$ Thank you! Just one question: why is it that in the 3rd graph, the nodes take so long to stabilize compared to the other two plots. It might not be visible but the time steps are the same. Yet plot 1 stabilizes so quickly, then 2, then 3. \$\endgroup\$ Commented Jun 5, 2023 at 2:33
  • 1
    \$\begingroup\$ @MohammedArshaan I don't think there is a specific reason, they chose a "nominal" time interval T between input and clock, and that determines the (statistical) time needed for the output to resolve metastability. So any small deviation from that nominal figure won't affect (on average) resolution time, but will of course change (in a random way) the final output state. In the upper two graphs you can see that, since the deviation from the nominal T is bigger, then the time needed for resolution is visibly affected (especially on the first diagram). \$\endgroup\$ Commented Jun 5, 2023 at 8:51
  • 2
    \$\begingroup\$ @MohammedArshaan for the fact that in the third diagram the average resolution time is longer than any of the traces of the other two diagrams, I think user jpa gave you a good explanation in his answer. I didn't read the article in depth, but it appears that they didn't explain how they chose the nominal T for the last diagram. It is possible that they actually determined the simulation that showed the biggest resolution time and then used that T as nominal for the last diagram, just to show that for some specific nominal T the resolution time can be quite long. \$\endgroup\$ Commented Jun 5, 2023 at 8:58
  • \$\begingroup\$ I see, thank you so much! \$\endgroup\$ Commented Jun 6, 2023 at 3:46

Your Answer

By clicking “Post Your Answer”, you agree to our terms of service and acknowledge you have read our privacy policy.

Not the answer you're looking for? Browse other questions tagged or ask your own question.